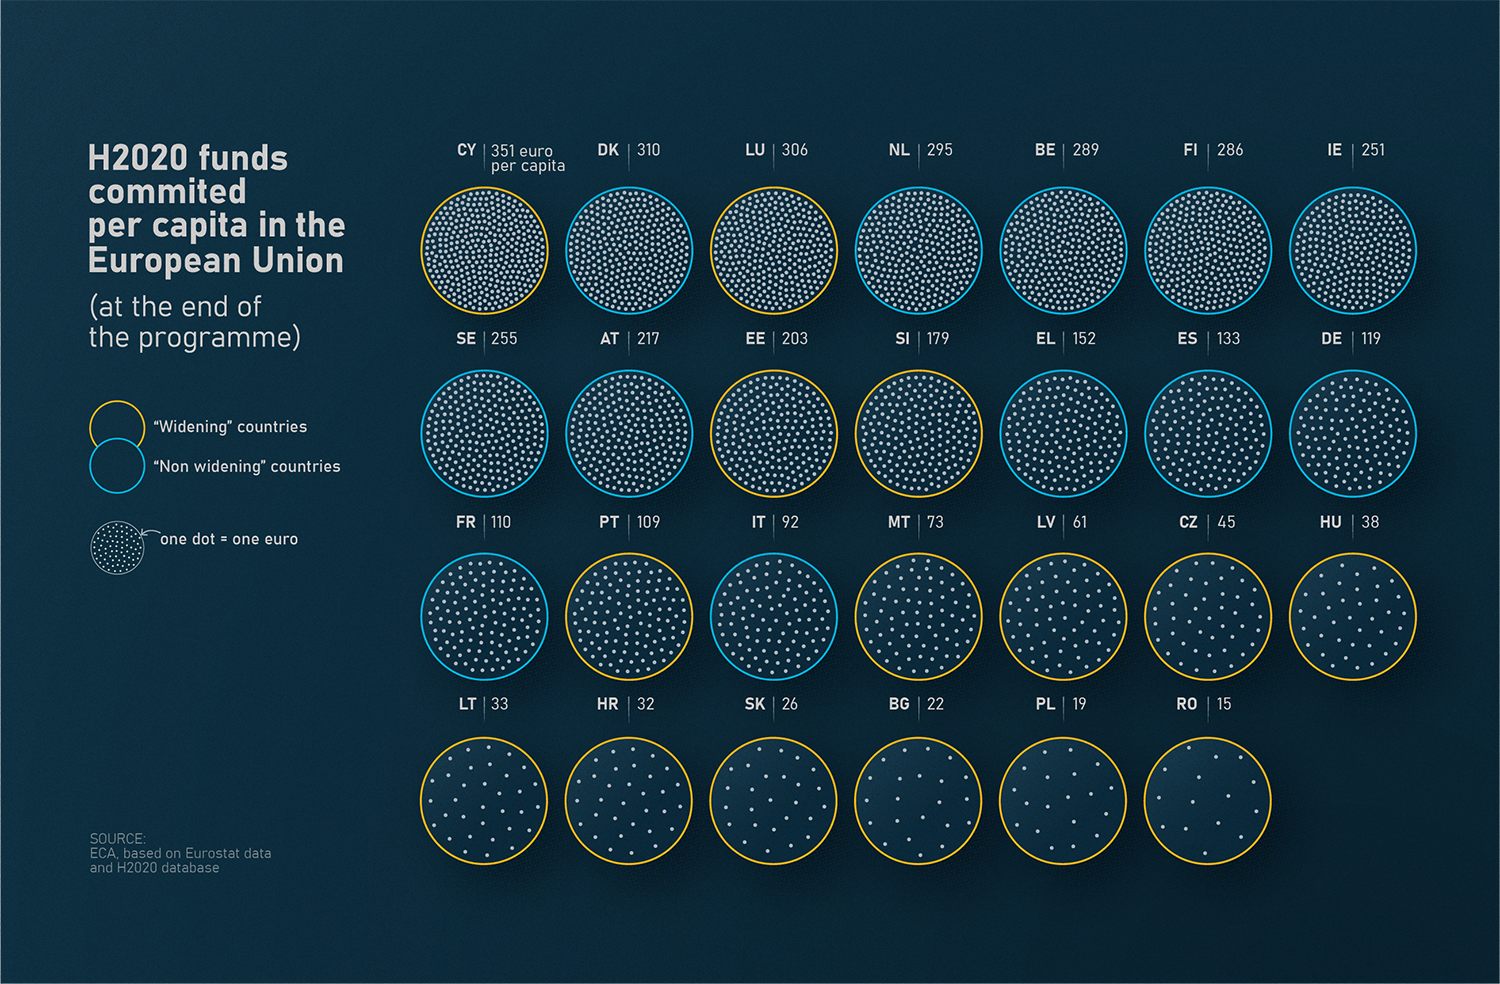
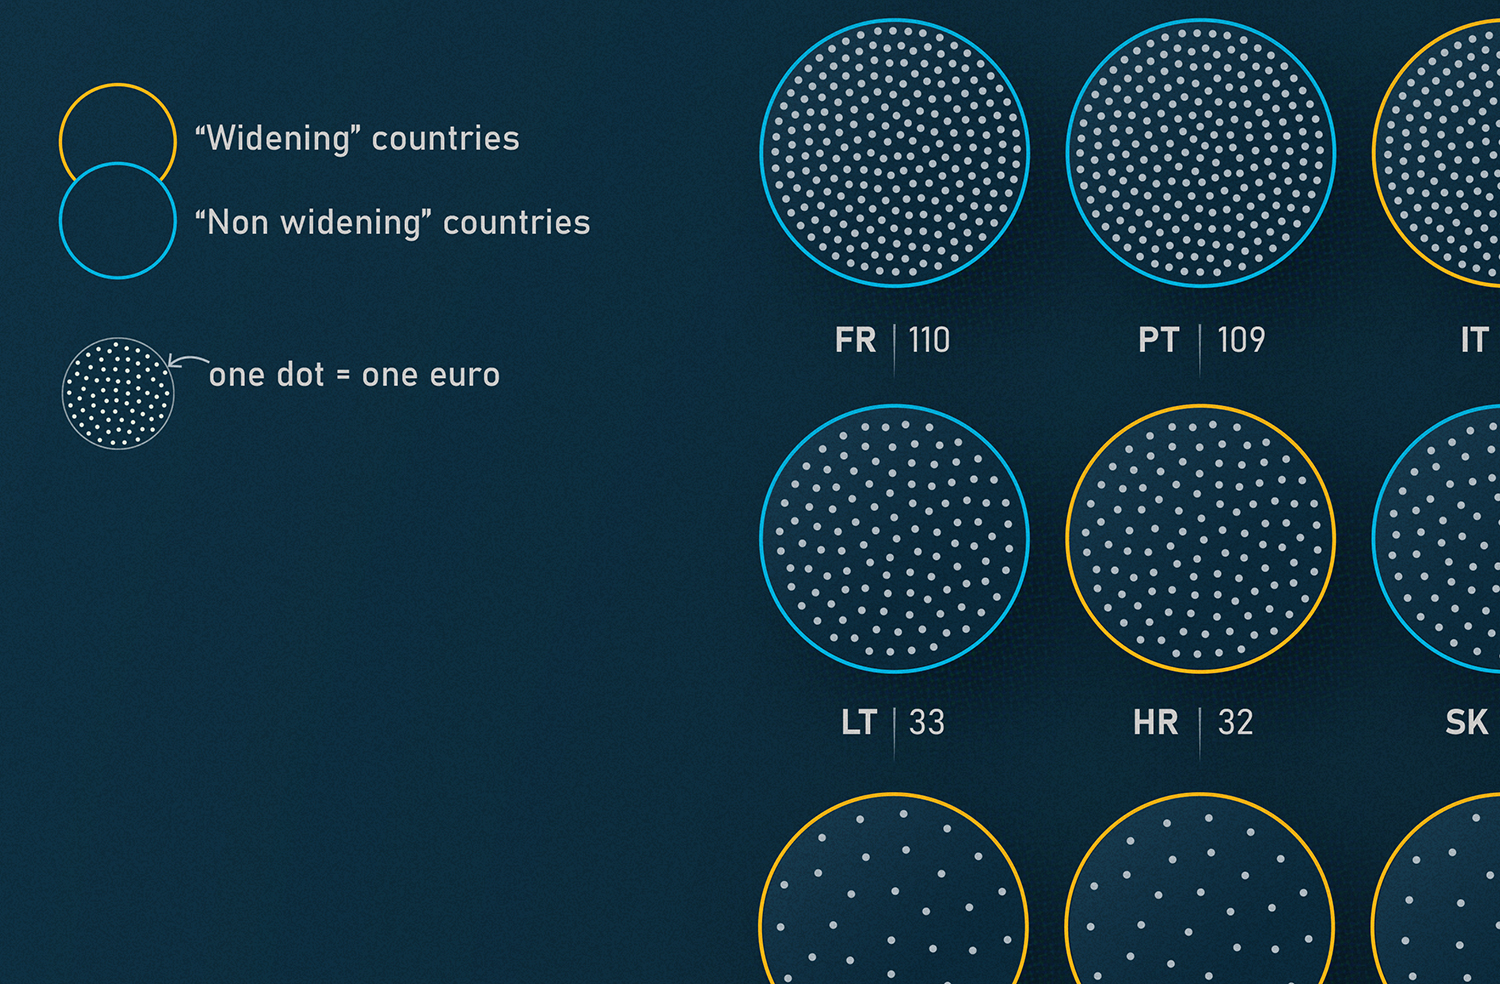
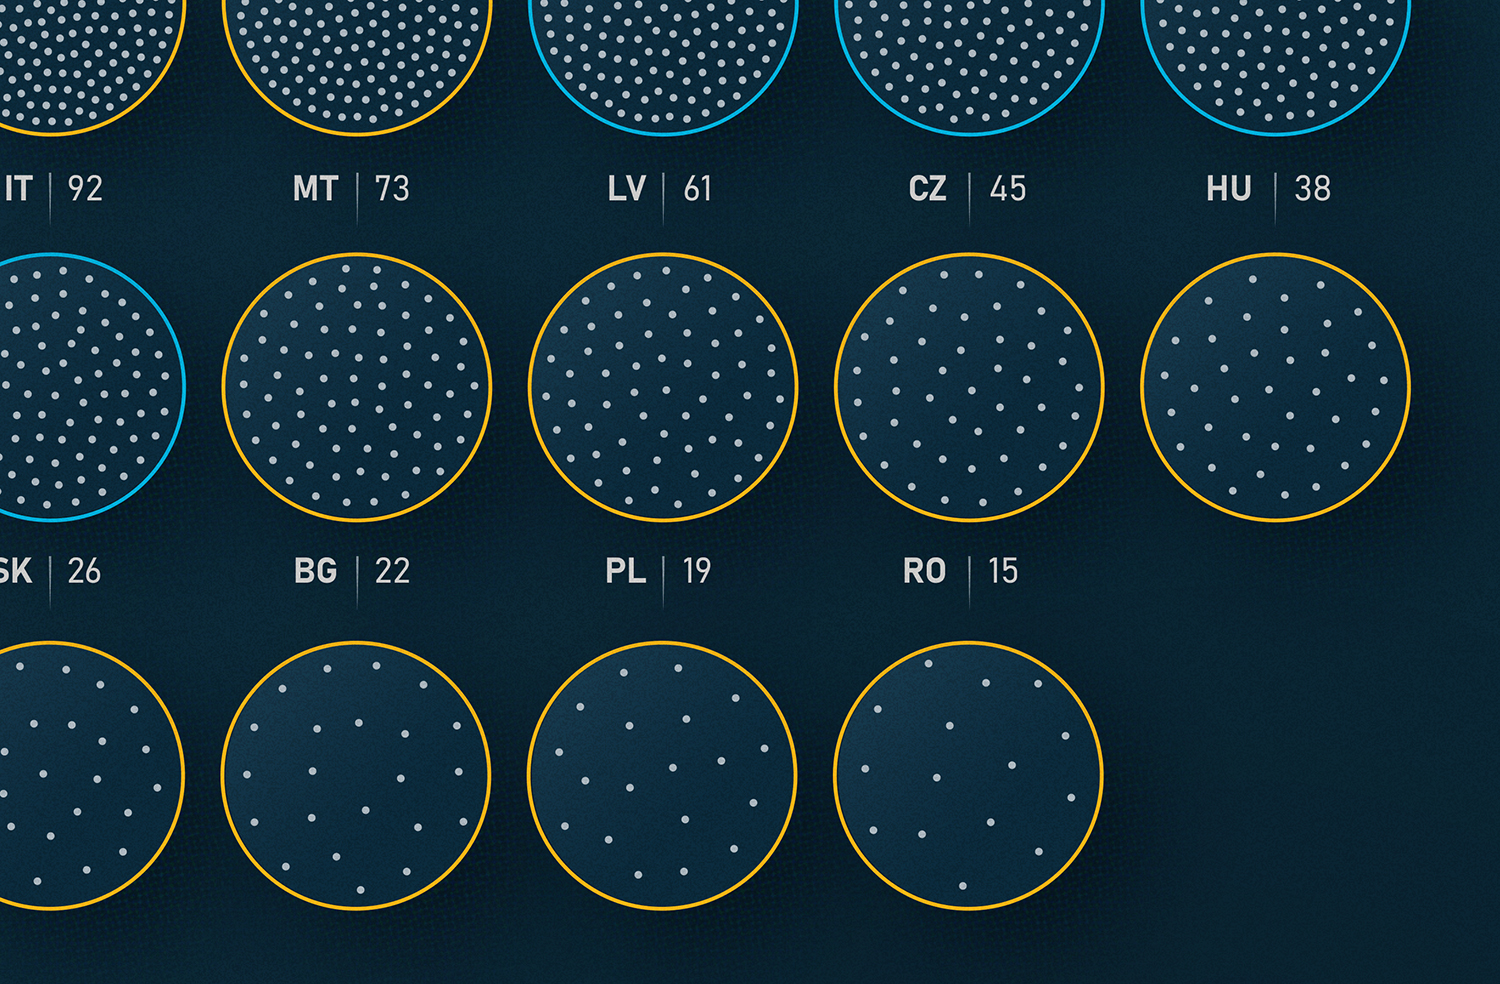
This data visualization project showcases the H2020 funding per capita in the European Union. This visual is a re-take on a more basic visualization I have created for a published report by the European Court of Auditors (ECA) published earlier this year. Unfortunately, as this new visual style did was not in line with that of the ECA's, thus it was eventually not published.


